Semantic bridge: From technical term to real life
We should try to turn “natural hazards” into real-life realities, i.e., move from a technical list to a socially effective early warning tool. The technical terms used in disaster management and geoinformatics must be translated into everyday language that is culturally relevant. This semantic bridge is essential to make early warning systems truly effective, especially in vulnerable regions with limited access to technical education and infrastructure.
Example: Subsidence – ground subsidence
Technical definition (IRDR): “Subsidence of the ground caused by groundwater extraction, mining, limestone dissolution, natural gas extraction or earthquakes.”
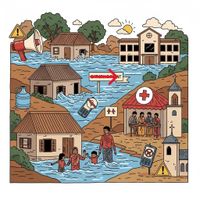
But what does that mean for a family in Malawi?
• For a mother: “The well is suddenly empty — we have to fetch water from further away.”
• For a child: “Our house has cracks — Dad says it could collapse.”
• For the community: “The road has subsided — the market is no longer accessible.”
A possible semantic translation
• “The ground is moving beneath our feet.”
• “The well has disappeared.”
• “The school is no longer safe.”
Technical ontology → Everyday semantics
• Subsidence = “place that sinks”
• Risk zone = “place where people are at risk”
• Infrastructure failure = “road is broken” / “bridge no longer usable”
Example 2: Critical Infrastructure
Technical meaning: Systems and facilities whose failure would have a serious impact on society.
But what does that mean for a family in Burundi?
• “The school is closed — there's no water.”
• “The hospital has no electricity — Mom can't be treated.”
• “No network — Dad can't be called.”
A possible semantic translation: Endangered school, place without light, no reception, place where help is needed
Why is this so crucial?
Because the danger only becomes real when it is
• linguistically understandable
• emotionally relatable
• culturally embedded
• visually and auditorily perceptible
Possible local communication
• WhatsApp graphics with symbols and simple language
• Voice messages in local languages, e.g., Chichewa, Swahili
• Megaphone announcements with specific instructions
• Visualization with locally recognized symbols, e.g., water jug, school or market
Is semantic translation already adequately addressed in GP-STAR and IN-MHEWS (focus on semantic logic and everyday language)? E.g., 100-year flood or even 1000-year flood (these figures convey security rather than urgency because they seem abstract and distant). Large numbers (in this context) have a calming rather than alarming effect, i.e., the larger the number, the greater the communication gap.
Narrative reversal
Not: “That was a once-in-a-century flood.”
But rather: “That was the third extreme flood in 20 years and the next one could come tomorrow.”
For the city where I live, this means in concrete terms that the great flood of 2002 (at the time a once-in-a-century flood measuring 9.40 m) was not an isolated incident. Since then, we have had two more floods (HQ50: 8.76 m – yet in the public perception, it was often referred to as “another once-in-a-century flood,” which leads to confusion) that were just as dangerous. This means that such events are not rare – they are part of our reality and we must be prepared.
Technical ontology → Everyday semantics / Local translation – possible integration into the Flood GUIDE project, i.e., a Flood GUIDE+ “From Impact Forecasting to Impact Understanding,” e.g., for Nigeria (Benue River) – From satellite image to understandable warning – together with local actors, development of a semantic toolkit)
These terms can also be integrated into Flood GUIDE+ as visual modules, audio formats, storytelling elements, or interactive tools, because semantic translation is not just a “soft topic” but a genuine integral part of early warning systems.
- Backwater effect: “Water backs up” / “River can’t flow further” / Arrows against the river’s direction
- Behavioral thresholds: “When the water reaches the bridge, you must leave” / Bridge with water level and red line – next to a person with packed bag
- Bridge collapse risk: “Bridge could collapse” / “Dangerous crossing” / Bridge with cracks and warning sign
- Catchment area: “Area that collects water” / “Rain that flows here” / Hills with arrows pointing to the river
- Climate impact risk: “Weather is getting more dangerous” / “Rain that didn’t used to be like this” / Cloud with lightning, raindrops and thermometer – next to a calendar with changing symbols
- Communication breakdown: “No signal” / “Phone doesn’t work” / Phone with crossed-out signal
- Community resilience: “How strong our community is” / “What we achieve together” / Village with protective wall and smiling people
- Confidence level: “How certain is the forecast?” / “We believe it will happen – but not entirely sure” / Bar with percentage indicator
- Contingency plan: “Plan B” / “What to do if this happens?” / List of alternatives Preparedness level: “How ready are we?” / “What we’ve already prepared” / Checklist with checkmarks
- Cultural memory: “What our grandparents experienced” / “This happened before” / Image of elderly person with flood scene
- Cumulative hazard: “Danger that builds up” / “Each time it gets worse” / Bar chart with rising red columns, next to a house sinking deeper into water
- Collective action: “We act together” / “Everyone helps” / Human chain or people carrying sandbags together
- Critical infrastructure: “Essential things for our lives” / “Electricity, water, hospital” / Symbols of power pole, well, clinic
- Crowdsourced data: “Information from all of us” / “What people report” / Phone with many small speech bubbles
- Data fusion: “Data is being merged” / “Many pieces of information form one picture” / Puzzle made of different data sources
- Data gap: “We’re missing part of the information” / “Hole in the map” / Map with gap or question mark
- Data latency: “Information arrives too late” / “Data is slow” / Turtle carrying a data packet
- Discharge: Flow volume “The discharge is twice as high today as yesterday.” / River with arrows growing thicker and faster
- Displacement risk: “People must leave their homes” / “Escape from the water” / Family with luggage on the road
- Drainage failure: “Water can’t drain” / “Clogged canal” / Water backing up at a drain with trash
- Dry spell: “Time without rain” / “Soil becomes hard” / Cracked ground with dried-up plant
- Emergency preparedness: “Disaster preparedness means knowing the evacuation plan.” / Checklist with house, arrow, assembly point – all with green checkmarks
- Early warning system (EWS): “Early warning” / “Signal of impending danger” / Bell with exclamation mark
- Early warning gap: “Warning came too late” / “No one was informed” / Bell with crossed-out symbol, next to flooded village with confused faces Major event with recurrence probability: “Major danger that happens often” / “Flooding again and again” / Calendar with multiple red flood symbols spread across years
- Evacuation center: “Safe gathering point” / “Place to go in danger” / People under a roof with a red cross
- External data source: “Data from outside” / “Satellite assistance” / Satellite over village with connection line Validation: “Confirmation by our people” / “Checked by us” / Thumbs-up with checkmark
- Extreme event: “Water that even reaches the hospital” / Hospital with water up to the roofline, red cross half submerged / Extreme flood: “Water up to the roofline” / “River becomes a street” / House with only the roof visible, next to a street sign in water
- False alarm: “Warning that turns out to be false” / “No water came after all” / Bell with crossed-out symbol
- Flash flood: “Sudden water” / “Water comes without warning” / Comic of surprised family and water wave
- Floating settlements: “Villages on water” / “Houses that float” / Huts on rafts
- Flood extent: “Area under water” / “Marketplace flooded” / Houses with water up to window height
- Flood modeling: “Prediction of where the water will flow” / Arrows showing river direction across a map
- Gendered vulnerability: “Women and children especially affected” / “Not everyone is equally protected” / Mother with child lacking shelter
- Geospatial intelligence: “Smart map” / “Map that knows more” / Map with eyes or thought bubble
- Geo-tagged reports: “Report with location data” / “Where exactly something happened” / Phone with location pin
- Groundwater: “Groundwater is rising – basements may get damp.” / House with waterline below ground, droplets rising upward
- Heavy rainfall event: “Sudden heavy rain” / “Rain like buckets pouring” / Cloud with dripping buckets instead of raindrops
- Hazard exposure: “Place where danger threatens” / “Area near the river” / Warning sign next to a house by the river
- Heavy rainfall event: “Sudden heavy rain” / “Rain like buckets pouring” / Cloud with dripping buckets instead of raindrops
- High population density: “Many people in a small space” / Many figures close together in one room
- Informal settlements: “Houses without solid construction” / “Village of huts” / Corrugated metal roofs and improvised paths
- Impact-based forecast: Evacuate zone X – Early warning based on model: Recipient says “Why now?” – possibly distrust or ignorance / Map with red zone, person with question mark above head, next to a megaphone The HQ100 area is flooded – satellite image + model: But “What does that mean for my house?” – possibly no concrete action / Satellite over map, house with waterline, person with questioning look HQ100 occurs with 1% probability annually – technically correct: But what does the recipient understand? “Only happens every 100 years” – misunderstood! / Calendar with 100 years, next to a red cross and sign: “Could happen tomorrow too”
- Interoperability: “Data fits together” / “Data speaks the same language” / Two speech bubbles with matching symbols inside
- Livelihood disruption: “Work stops” / “Fisher can’t fish” / Boat on dry ground
- Local champions: “People we trust” / “Those who help when it gets serious” / Portrait with cape or star
- Market access blocked: “No access to the market” / “Road flooded” / Vendor with empty basket in front of water
- Mobile-based alerting: “Alert on the phone” / “Message that beeps” / Phone with red exclamation mark
- Model-based forecast: “We have indications that major flooding is coming soon” / Map with river, arrows showing spread, next to a computer with warning symbol
- Multi-risk situation: “Multiple hazards at once” / “Storm and flood together” / Two overlapping symbols: storm cloud with lightning + wave with house – both hitting a village
- No-regret measures: Actions that are always sensible – even if no disaster occurs / Toolbox with checkmark or sun symbol (for “always good”)
- Offline access: “Information even without internet” / “Data you can store” / Phone with memory chip
- Ownership: “Our data, our decision” / Hands holding a map together
- Power outage zone: “Place without light” / “Dark neighborhood” / Dark houses with candles or flashlights
- Rainfall anomaly: “Rain falls differently than usual” / “More or less than normal” / Cloud with question mark
- Real-time data: “Current information – right now” / Clock with radio signal or live icon
- Resilience indicator: “How well we’re prepared” / “What we’ve already achieved” / Shield with checkmark, sandbags in front of house, smiling family with checklist
- Response capacity: “What we can do” / “How quickly we can help” / Firefighter with equipment
- Recovery timeline: “How long until everything is okay again?” / Calendar with progress bar
- Reprojection: “Adjustment to our map” / Puzzle pieces being reassembled
- Risk aversion: “Better not to take risks” / “We prefer to stay safe” / Person stepping away from dangerous path Protective action decision: “When we take action” / “What we do when danger comes” / Person with directional decision arrows
- Risk communication failure: “The warning wasn’t understood” / “No one knew what to do” / Speech bubble with question mark
- Risk communication: “How we talk about danger” / “What people truly understand” / Two speech bubbles: one with technical symbols (model, diagram), one with everyday symbols (house, water, arrow)
- Risk fatigue: “Another warning again?” / “We’re not listening anymore” / Person with annoyed face and warning symbol
- Risk perception: “How seriously we take the danger” / “Whether we act or wait” / Person with two thought bubbles: one saying “all good,” one saying “water is coming” – face shows uncertainty
- Risk indicator: “Sign of impending danger” / “Hint of risk” / Thermometer with rising red scale
- Riverbank erosion: “Riverbank breaks away” / “Land disappears by the river” / House at the edge, soil falling away / “Due to bank erosion, the village loses land.” / Riverbank with sloping soil, house dangerously close to the edge
- Road washout: “Road washed away” / “No path left” / Road ending in water
- Rumor vs. verified info: “What’s actually true?” / “Rumors or real warning?” / Two speech bubbles – one with question mark, one with checkmark
- Safe route: “Path that isn’t flooded” / “Route with green arrow” / Map with footprints on safe path
- Scenario modeling: “What if…?” / “If it rains more, this will happen” / Comic with two possible future scenes
- Seasonal migration: “People move because of rain” / “Migration during dry season” / Family with luggage on the road
- Shelter-in-place: “Stay where you are” / “Don’t go outside” / House with lock and family inside
- Social vulnerability: “People with little protection” / “Poor neighborhood” / Family without a roof over their heads
- Sensor-based alert: “Warning from measuring device” / “Device detected something” / Image of a device with blinking light
- Shapefile: “Boundaries and locations on the map” / Map with colored outlines and location markers
- Stakeholders: “Decision-makers” / “Key participants” / Roundtable with various figures
- Surface water: “Surface water collects on streets.” / Street with puddles or cars driving through water
- Trigger threshold: “Limit at which something happens” / “When the water level is this high, we must respond” / Gauge with red line
- Traditional knowledge: “What we’ve always known” / “Old signs of danger” / Grandmother pointing at clouds or animals
- Trust in warning: “Do we believe the warning?” / “Who said it?” / Microphone with familiar face
- Validation: “Confirmation by our people” / “Checked by us” / Thumbs-up with checkmark Stakeholders: “Decision-makers” / “Key participants” / Roundtable with various figures
- Warning level red: “Major danger – act immediately” / Red triangle with lightning symbol
Closing the last gaps means making the invisible factors truly visible in behavior, trust, inequality, nature, and system logic. These terms are often not found in databases, but they determine whether early warnings are understood, believed and acted upon.

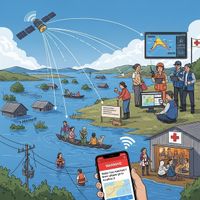
Although platforms such as Google's Flood Hub already exist to visualize global flood risk and provide early warnings, they remain data-centric and technical, i.e., without semantic, cultural, and social translation at the local level. A Flood Data Translation Hub (FDTH) could bridge the gap between global technology and local reality. The goal is to translate spatial data in disaster and emergency management in such a way that it becomes understandable, accessible, and actionable for the civilian population. Whether satellite images, early warnings, or risk maps, it is only through linguistic, cultural, and visual translation that this information can be fully effective. The FDTH could start exactly where data often falls short, namely in the “last mile” between technical excellence and local protection.
There is still far too little discussion of how difficult it is for local actors to understand much of the data, and this is precisely where UN-SPIDER could make a concrete contribution. Although these frameworks mark very important progress, one key challenge remains: the gap between global data structures and local comprehensibility.
Many valuable milestones mark this path, e.g., the Hyogo Framework for Action (HFA) (2005) and the Sendai Framework for Disaster Risk Reduction (2015). Under the umbrella of the Committee on the Peaceful Uses of Outer Space (COPUOS), the UN-SPIDER platform was founded in 2006 and supports countries worldwide in the use of space-based data in all phases of disaster management, particularly in priorities 1 and 4 of the Sendai Framework.
UN-SPIDER is already doing a great deal, but perhaps there is still room for strategic deepening in the direction of “human-centered design” and “behavioral risk communication.” Perhaps a new working group within GP-STAR or IN-MHEWS on the topic of “Semantic Risk Translation & Local Engagement,” for example.
Many international organizations and research institutes are heavily data- and technology-driven. They develop complex models, maps, and dashboards — often with the claim of being “objective” and “scientific.” However, it is often forgotten that data without context cannot have the desired effect. International frameworks such as the Sendai Framework work with global indicators, ISO standards, and standardized terms. This is very important for comparability, but it also means that local needs and comprehensibility are lost. An early warning system that works in English is of little use in a place where only Kiswahili is spoken.
You always need a little money for the “last mile.”
A lot of money is spent on satellites, sensors, and data platforms, but funding for the “last mile” i.e., the translation, visualization and communication of data to the population — is lacking. Local NGOs, radio stations and community leaders who could build this bridge are often not sufficiently involved.
Technology providers, data analysts, humanitarian organizations, and local authorities often work alongside each other rather than with each other. There is a lack of appropriate interfaces, joint projects, and genuine co-creation. A wealth of excellent data is available, but who feels responsible for making it understandable?
Underestimating “simple” communication: In many professional circles, simple language or visual simplification is considered “trivializing.” But that is precisely the key to effectiveness. A clear, locally understandable message can save lives — a complex dashboard, unfortunately, cannot.
- Language barriers: Data is often only available in English or technical jargon. Terms such as “return period,” “hazard exposure,” and “impact forecast” are familiar to experts, but often misunderstood by the general public.
- “Hazard exposure” sounds like a laboratory term, because the word “exposure” is abstract, unfamiliar, technical. There is no image for it in everyday language, meaning people do not know whether they themselves are affected.
- “Impact Forecast” is not really a wake-up call. It sounds like a weather report for experts, but not like an urgent warning. It lacks the emotional impact of “Your house could be under water tomorrow,” and so the technical wording remains cognitively distant and emotionally empty.
- Cultural decoupling: Global standards ignore local contexts, customs and decision-making logic.
- Emotional connectivity: Language that creates images in the mind, e.g., “rain pouring down,” “dark neighborhood,” “water up to the roofline.” Symbols that are immediately understood, even without writing or technical education.
- Local integration: Terms that are culturally relevant, e.g., “meeting point at the school,” “place where people go when in danger,” i.e., integration of local memory culture, “like during the heavy rain 10 years ago.”
- Participatory validation: warnings confirmed by the community “Verified by us,” i.e., data sovereignty “Our data, our decision.”
- Lack of communication: There is a lack of resources for translating, visualizing and communicating the data to the communities affected.
Let us think of the tsunami in Indonesia (2018), the flood disaster in Germany (Ahr Valley, 2021), Cyclone Idai in Mozambique (2019), and others.
Data ecosystems are fragile and often cannot be connected locally. For example, if central data platforms such as USAID fail, the system collapses and local actors are left without comprehensible information.
What if risk perception is distorted by poor communication and cultural differences and warnings are ignored or misinterpreted because they have not been adapted to local conditions?
Cultural differences in risk perception
People assess risks not only rationally, but above all through
o Experiences, e.g., “It rained before, but it never flooded.”
o Belief systems, e.g., religious interpretations of natural events
o Trust in institutions, e.g., distrust of government or international organizations
o Social norms, e.g., men stay with livestock, women flee with children
These cultural factors then lead to warnings being interpreted differently or ignored — even if they are technically correct.
Lack of localization of warning systems
Warning systems were developed centrally without involving local actors.
There was a lack of:
o Community-based communication channels, e.g., local radio stations, town and village meetings.
o Participation in the design of warning messages.
o Anchoring in local decision-making structures, e.g., trusted individuals in the residential area, village elders, religious leaders.
communication gaps
Early warnings were not communicated in a clear, understandable, or target group-appropriate manner. Communication should not only inform, but also influence behavior, and cultural factors are very important in this regard. Technocratic approaches often ignore the cultural dimension, i.e., a practice-based risk culture is needed here.
Common problems:
o Use of technical language or jargon.
o Lack of translation into local languages or dialects.
o Inadequate visualization, e.g., no easy-to-understand maps or symbols.
o No instructions for action — many warnings say what will happen, but not what to do.
Possible communication formats for the “last mile”
• Voice messages in local dialects referring to familiar events.
• Pictograms and comics with familiar scenes, e.g.
- Animals flee from fire (birds fly away, deer run – as a symbol of wildfire danger)
- Water rises above familiar buildings such as village church, school, or market – indicates flood risk
- Cracks in the ground beneath a house: sign of earthquake or land subsidence
- People wearing masks in dust clouds as a symbol of sandstorms or air pollution
- Trees losing leaves during drought: visual representation of climate change impacts
- Child washing hands with soap, sun smiling: simple hygiene message
- A family walks uphill, water rising behind them: evacuation during flood
- A man strikes a gong, village gathers: ritualized warning
- Animals run in one direction, people follow: intuitive flight signals
- A woman packs an emergency bag with symbols (water, radio, medicine): disaster preparedness
- A field with withered crops – sad farmer: drought and crop failure
- A woman with an empty bucket at the well – no water: indication of water scarcity
- Animals from local myths as warning figures: e.g. tiger, elephant, eagle
- Stickers with symbols for doors, bicycles, water containers: e.g. “Safe water,” “Evacuation route”
- Arrows with animals or colors: e.g. “Follow the red bird” – simple wayfinding
- Bridge with cracks – red exclamation mark: danger from damaged infrastructure
- Sun with angry face over dry ground: symbolizes extreme heat
- Man/woman with sweat on forehead, thermometer exploding: visual exaggeration for heatwaves
- Fire devours fields with crop loss: shows economic consequences
- Animals leap across burning grasslands: e.g. antelopes or wild boars – shows escape behavior
- Boats drifting through streets, people waving from rooftops: dramatic evacuation scene
- Fish swimming through classroom: exaggerated depiction of school flooding
- A child holds a toy above water, parents lift them up: emotional scene with recognition
- Water floods market stalls with local products: shows loss of cultural infrastructure
- House tilts sideways, family runs out: visual dynamic for acute danger
- Road with deep crack, cyclist stops abruptly: everyday scene with warning symbolism
- Sleeping people awakened by tremors: shows nighttime threat
- Well falls into earth fissure – villagers look shocked: loss of vital infrastructure
- City disappears behind gray wall, only outlines visible: symbolizes smog
- Person coughing, tree next to them wears gas mask: exaggerated depiction of environmental pollution
- Cow stands before empty trough, sun blazing: shows impact on livestock
- Well with “empty” symbol, person with empty bucket: direct message
- Plant with roots reaching for water: metaphorical representation
- Family shares a single water bottle, child looks sad: emotional impact
- Village map with arrows showing evacuation direction: functional visualization
- House covered in snow, door blocked – resident waves from window: shows isolation
- Narrative formats: Stories about “Grandfather's Flood” as a warning for the next generation, mobile cinema trucks, drum communication and songs, QR codes on everyday objects, memes and GIFs, stickers with symbols for doors, water canisters, bicycles: e.g. “flood zone,” “safe drinking water,” “evacuation route,” QR codes on everyday objects, radio in local languages with call-in option, marketplace performances, comic strips in local newspapers, community meetings with storytelling, influencer campaigns on TikTok and Instagram, church networks, apps with gamification, Bollywood-style short films, shadow theater and puppet shows, SMS chains via village elders ... The list is endless.
- Ritualized warning signs: bell ringing, flags, drums, temple warning systems, murals (street art) – always embedded in the local culture.
We rely on experience, e.g., “It used to rain heavily, but there was never flooding.”
We love to rely heavily on past experiences. But what if people rely on traditional weather signs — such as animal behavior or cloud formations and fail to adequately recognize new risks posed by climate change or increasing urbanization because they lie outside their previous experience?
What about belief systems? In many cultures, natural events are interpreted spiritually or religiously. Disasters are seen as punishment, trials, or divine will. What if technical explanations are rejected and early warnings are not perceived as relevant because they do not fit into the spiritual worldview? Communication must involve religious authorities in order to build trust and bridge divides.
What about trust in institutions, e.g., statements such as “The government lies anyway”? Risk perception depends heavily on trust in the source of information, and if institutions are perceived as corrupt, incompetent, or alien, their warnings are ignored or doubted. If the warnings are perceived as exaggerated or politically motivated, even accurate data quickly loses its impact if the communicating authority is not credible. Early warning systems must make use of local multipliers, e.g., teachers, local and village elders, and health workers.
What about social norms? In many societies, there are gender-specific roles that influence behavior in the event of a disaster (even if the warning calls for immediate evacuation). These norms can then lead to delayed or incomplete responses, which increases the risk. Or what about patriarchal structures or collectivist cultures where the welfare of the group is placed above individual protection? All of this also has an impact on disaster preparedness.
How about developing an IEEE P-RISK 1000 as a “communication layer” for technical risk standards, for example? The IEEE P-Risk 1000 should not be a technical risk assessment standard, but rather a translation and activation standard.
This could perhaps be an addition to IEEE 16085.
16085 already covers:
• Risk identification, analysis, assessment and treatment
• Documentation and stakeholder management
• Integration into software and system development processes
A possible P-RISK 1000 could potentially add to this: a “Risk Communication & Activation” module
→ New process phase after “Risk Treatment”
→ “How is the treated risk communicated, visualized, and translated into action?”
A possible technical integration, i.e., an addition to the “information items” to include:
o Risk narrative (storytelling elements)
o Risk visuals (infographics, maps, icons)
o Risk activation scripts (action guides for target groups)
Link to stakeholder analysis → Target group-specific communication formats
A possible example: A flood risk is not only documented as “Level 3,” but as “There is a 60% probability of flooding in Zone A in the next 72 hours. Schools should activate evacuation plans. Citizens will receive push notifications with recommendations for action.”
Or an addition to IEEE 3119 – AI in disaster management
3119 already covers:
• AI-supported risk detection, decision support, data processing
• Focus on technical systems, not communication
P-RISK 1000 could potentially complement this:
Output standardization for AI systems: AI generates risk assessment → P-RISK 1000 defines how this is communicated
• Integration into human-centered AI: Explainable risk: AI results are explained narratively and visually, creating a trust layer: Citizens understand why a warning is issued
A possible technical integration: API interface: AI systems deliver JSON → P-RISK 1000 transforms into: text modules for warning messages, icons for mobile apps, and maps for WebGIS systems
A possible example: The AI detects the risk of forest fires → P-RISK 1000 then generates, “Forest fire hazard in Zone B. Please avoid open flames. Fire department is on standby.”
Or an addition to IEEE 1873 – Robotics in disaster response
1873 already covers:
• Specifications for robotic systems in use
• Sensors, navigation, interaction with emergency services
P-RISK 1000 could perhaps complement this: Communication interface for robots, e.g., sensors detect risks → P-RISK 1000 translates in real time for those affected
• Integration into human-robot interaction (HRI): Robots provide visual, acoustic, and narrative cues / Standardized icons, colors, language modules
A possible technical integration:
• Extension of the HRI specification to include: Risk messaging protocols, e.g., “Zone red—evacuation recommended” or multimodal communication (display, voice, light signals)
A possible example: A search and rescue robot detects a gas leak → P-RISK 1000 controls: “Warning: Gas leak detected. Please use respiratory protection. Avoid the area.”
With the aim of developing a crosswalk matrix to bridge the gap between space and disaster management communities.
IEEE P-RISK 1000 could close this gap to some extent through standardization by:
• Narrative risk descriptions, e.g., “What does a 60 percent probability of flooding mean for me?”
• Visual risk formats (maps, symbols, infographics)
• Behavioral activation protocols, e.g., evacuation plans for schools, citizen alerts
UN-SPIDER has already published recommended practices for the use of satellite data in disaster situations, including:
• Flood mapping
• Fire scar analysis
• Drought monitoring
• Landslide susceptibility
These practices are already technically mature, but is it also a standardized communication level?
A potential P-RISK 1000 (or whatever it may be called) could then add the following:
• An appendix on risk communication for each practice
• Templates for community briefings, school posters, mobile alerts
• Guidelines for translating geodata into local dialects and cultural formats
UN-SPIDER is already conducting TAMs in countries such as Sri Lanka, Nigeria, and Guatemala to assess the following:
• Institutional capacities
• Data access
• Emergency coordination
A possible P-RISK 1000 could perhaps be embedded here as:
• A risk communication module in TAMs
• A checklist for assessing local communication readiness
• A toolkit for training local actors in risk communication and visual literacy
A possible example: In a TAM for regions at risk of flooding
• Satellite data shows a high risk of flooding
• P-RISK 1000 could support local authorities in creating:
o SMS alerts with symbols and simple language
o Handouts for schools with evacuation maps
o Radio scripts for local and community leaders / local radio stations / mobile phone providers / social media influencers with local connections • Churches, mosques, temples as places of trust / civil protection
Scientific validity: Behavioral risk communication
P-RISK 1000 could draw on interdisciplinary science in this regard:
• Cognitive psychology: People act based on stories, not statistics.
• Visual semiotics: Symbols and colors influence the perception of urgency.
• Crisis communication: The wording of messages influences compliance with regulations.
The EvIDENz project could also perhaps supplement IEEE P-RISK 1000, because EvIDENz already shows what we know — but IEEE P-RISK 1000 could also show how we act. The development of a systematic, scalable communication framework that transforms technical risk data into understandable, locally effective messages would be a further advantage for this valuable project.
How about supplementing EvIDENz with a communicative activation module that translates the risk information from the project into understandable, visual, and action-relevant formats — for schools, communities, NGOs and the media?
An example:
- Drought hazard map Sentinel-1, NDVI, crop loss + Color maps with icons and legend
- Affected population Statistical estimate + SMS warning “Drought hazard – save water!”
- Economic losses Modeled damage amount + Radio script “How to protect your harvest”
- Possible scientific synergy, i.e., risk analysis Remote sensing + Statistics Behavioral psychology + Semiotics /Target group approach Authorities + Population, schools, NGOs, teachers, community leaders, local organizations / Sendai Goals B & C B, C + E (“early warning”) / Implementation level Decision preparation + Triggering action
- Evidence recognizes: NDVI values are falling, drought risk is high (geoinformatics, remote sensing, spatial statistics - Language: English, technical, data-based - Goal: Decision support at the national level - Communication formats: dashboards, reports, workshops) = P-RISK 1000 (behavioral psychology + semiotics - language: localized, visual, narrative, action-oriented - goal: behavioral activation at the local level - communication formats: SMS, radio, posters, social media, school materials, and much more). Uses findings from risk perception theory (Slovic, 1987), i.e., how do people perceive risk? Integrates semiotics: how do colors, symbols, language, and narratives affect attention, understanding, and action? Methodologically anchored in cognitive psychology, communication design, and behavioral science. Goal: Subjective, action-relevant risk transformation for the population, NGOs, and more. Possible output: Activates school poster “What is drought? What to do?” or a radio script for mayors “Inform your community – distribute water” / Evaluation: 78% of households respond within 48 hours
- EvIDENz + P-RISK 1000 = Resilience 360° (dual-modal risk model) = integrative model for data-based and behavior-oriented disaster prevention
- Synergy potential: EvIDENz addresses decision-makers and P-RISK 1000 addresses those affected, i.e., together they create a multi-scale communication approach that could combine top-down and bottom-up approaches.
Framework component – Integration of remote sensing and behavioral risk communication: A dual approach to reducing disaster risks
Risk analysis: Remote sensing + statistics / behavioral psychology + semiotics
Target audience: Authorities / general public, schools, NGOs
Sendai Targets: B & C (Target B: Reduce the number of people affected, Target C: Reduce economic losses with a focus on monitoring and evaluation / B, C + E (“Early warning”), i.e. Target B & C: through communicative prevention, Target E: Early warning through understandable, activating communication with a focus on behavioral change and resilience building. EvIDENz provides the data basis for the Sendai targets and P-RISK 1000 could make this effective through communication.
Geobased data (Evidence)
• Satellite data: Sentinel-1 (radar), Sentinel-2 (optical), MODIS (vegetation, temperature)
• Indicators: NDVI (vegetation index), soil moisture, land surface temperature, flood areas
• Socioeconomic data: population density, infrastructure, agricultural use, vulnerability indices
• Geostatistical modeling: spatial interpolation, cluster analysis, hotspot detection
• Time series analysis: seasonal patterns, anomalies, trend forecasts
• Risk mapping: combination of hazard, exposure and vulnerability to derive risk zones
Behavioral data (a conceivable P-RISK 1000)
• Risk perception studies: standardized surveys on subjective assessments of natural hazards
• Focus groups: qualitative interviews with various target groups, e.g., schoolchildren, community leaders
• Semiotic analyses: impact of colors, symbols, language and narratives in risk communication
• Message testing: experimental testing of communication formats, e.g., text messages, posters, audio
• Behavioral simulation: scenario-based simulation of response behavior to warnings
• Communication design: development of visual-narrative prototypes for different target groups
A communication matrix should not be seen as a downstream measure, but rather as a real, integral part of the risk process chain. The subsequent communication of risk data should be considered as early as the collection and modeling stage. This also requires close cooperation between geoscientists, designers, educators and psychologists.
Impact measurement should not be viewed as a one-time evaluation, but rather as a continuous learning process:
• Iterative adjustment: Optimization of communication formats based on impact results
• Stakeholder feedback: Incorporation of feedback from authorities, schools, and communities
• Knowledge integration: Feedback of results into the further development of standards, e.g., IEEE, UN-SPIDER
A possible implementation level: Decision preparation / Action initiation
• Dashboard link: Integration of risk data into interactive platforms with narrative translation
• Multimodal interfaces: Combination of maps, text, symbols, and recommendations for action
• Contextualization: Local adaptation of content based on cultural, linguistic, and social factors
Possible case studies:
• East Africa (drought): Use of EvIDENz to identify crop failures, coupled with P-RISK communication in schools and communities
• Southeast Asia (flooding): Real-time monitoring of flooding followed by behavioral framing via radio and social media
• Control groups: Regions with purely technical warnings vs. regions with dual-modal communication
• Metrics: Response time, evacuation rate, level of understanding, trust in source, triggering of action
• Pre-/post-surveys: Change in risk perception and decision-making ability
• Mobile analytics: Click behavior, dwell time, forwarding of warnings
• Satellite-based damage assessment: Validation of actual impacts compared to predicted risks
Resilience chain [Satellite data] → [Statistical risk analysis] → [Strategic decision] → [Communicative translation] → [Understanding] → [Action] → [Resilience] = Two sciences – one mission
- Slovic, P. (1987). Perception of Risk. Science, 236(4799), 280–285. Perception of Risk. Ein Schlüsselwerk zur subjektiven Risikowahrnehmung, das zeigt, wie emotionale, kulturelle und kognitive Faktoren die Reaktion auf Gefahren beeinflussen.
- Cutter, S.L. et al. (2003). Social Vulnerability to Environmental Hazards. Social Science Quarterly. Dieses Werk definiert zentrale Konzepte zur räumlichen Vulnerabilität und bildet die Grundlage für die Integration sozialer Indikatoren in geobasierte Risikomodelle.
- UNDRR (2015). Sendai Framework for Disaster Risk Reduction 2015–2030 Sendai Framework for Disaster Risk Reduction 2015–2030. Das internationale Referenzdokument für Katastrophenvorsorge, das die Ziele B, C und E operationalisiert und als normativer Rahmen für EvIDENz dient.
- IEEE Standards Association (2022). P-RISK 1000: Behavioral Risk Communication Protocol. Der normative Rahmen für verhaltensorientierte Risikokommunikation, auf dem das hier vorgestellte Modell basiert.
- Copernicus Programme (2021). Earth Observation for Disaster Risk Management. Technische Leitlinien zur Nutzung von Sentinel-Daten für die Risikoerkennung und Frühwarnung.
- Weinstein, N.D. (1989): Optimistic Bias About Personal Risks. Belegt die Tendenz zur Unterschätzung persönlicher Gefährdung – ein zentrales Hindernis für wirksame Risikokommunikation.
- Witte, K. (1992): Extended Parallel Process Model (EPPM). Modell zur Erklärung, wann Warnungen zu Handlung führen und wann sie ignoriert werden – Grundlage für eine mögliche Gestaltung von P-RISK 1000-Botschaften.
- Kress, G. & van Leeuwen, T. (2006): Reading Images: The Grammar of Visual Design. Fundamentale Theorie zur visuellen Bedeutungskonstruktion, die die semiotische Gestaltung von Risikobotschaften unterstützt.
- Frascara, J. (2004): Communication Design: Principles, Methods and Practice. Praxisorientierte Anleitung zur Gestaltung verständlicher und wirksamer Informationsformate für unterschiedliche Zielgruppen
- Kelman, I. et al. (2016): Integrating Disaster Risk Reduction and Climate Change Adaptation. Zeigt die Notwendigkeit integrativer Ansätze, die technische, soziale und kommunikative Komponenten verbinden.
- Paul Slovic (2000): The Perception of Risk Erweiterung seines Klassikers von 1987 – vertieft die Rolle von Affekt, Heuristik und kultureller Prägung.
- Baruch Fischhoff et al. (1981): Acceptable Risk Zeigt, wie Menschen Risiko akzeptieren oder ablehnen – wichtig für Schwellenwerte und Risikokommunikation.
- George Loewenstein et al. (2001): Risk as Feelings Betonung emotionaler Reaktionen auf Risiko – zentral für visuelle und narrative Formate.
- Wisner, B. et al. (2004): At Risk: Natural Hazards, People’s Vulnerability and Disasters Klassiker zur Verwundbarkeit – betont lokale Perspektiven und Bottom-up-Ansätze.
- GFDRR & World Bank (2016): Solving the Last Mile Problem Fokus auf die Übersetzung technischer Warnungen in lokal verständliche Formate – direkt anschlussfähig an Flood GUIDE+
- UNESCO/IOC (2018): Early Warning Systems: A Checklist Praktische Kriterien für wirksame Warnsysteme – inkl. Kommunikation, Vertrauen und Zugang.
- Don Norman (2013): The Design of Everyday Things Zeigt, wie intuitive Gestaltung Verhalten beeinflusst – wichtig für Icons, Apps, Karten.
- Edward Tufte (2001): The Visual Display of Quantitative Information Klassiker zur Gestaltung von Datenvisualisierungen – relevant für Karten, Diagramme, Dashboards.
- Anne-Marie Willis (2006): Ontological Designing Theorie zur Gestaltung von Bedeutung – passt perfekt zur semantischen Brücke zwischen Ontologie und Alltag.
- Breakwell, G.M. (2014): The Psychology of Risk Systematische Darstellung von Risikoverarbeitung – inkl. Vertrauen, Kontrolle, Identität.
- Fischhoff, B. (1995): Risk Communication: A Mental Models Approach Zeigt, wie man Kommunikation an das tatsächliche Verständnis der Zielgruppe anpasst – Grundlage für semantische Toolkits.
- Renn, O. (2008): Risk Governance Modell zur Einbindung von Stakeholdern und zur Gestaltung von Risikokommunikation als Governance-Prozess.
Many of these works emphasize that risk is not just a number, but a lived, felt and communicated phenomenon. They provide the theoretical and practical basis for a Flood GUIDE+ that not only sends data, but also generates understanding — through visual grammar, cultural resonance, and behavior-oriented communication.
- Semantics & Space Travel – Early Warning Made Understandable
- Risk Translation & Local Communication Practices
- Last Mile Simulator
This article was written by Birgit Bortoluzzi, creative founder of the “University of Hope” – an independent knowledge platform for resilience, education, and compassion in a complex world. (created: 09/12/2025)